Data · November 13, 2026 · 7 min read
Excel or Power BI: when is it time to switch to a dashboard?
By Abdellah El Ghazi, founder of TeamElGhazi (training and automation in Maarif, Casablanca, Morocco)
Short answer: stick with Excel while one person builds an occasional report from a single file. Move to Power BI when the same report comes back every week, when the numbers come from several sources, or when several versions of the file are going around: a shared dashboard refreshes in one click and shows everyone the same figures.
We hear this question all the time, from course participants and from the small businesses we work with in Casablanca: "We run everything in Excel. Should we move to Power BI?" Many people assume it's the same thing with nicer charts, since Excel already does charts. It isn't. The two tools solve different problems.
This guide helps you decide without the jargon: what each tool is for, five signs that Excel is no longer enough, what Excel still does better, and where to start.
Excel and Power BI do different jobs
- Excel is a spreadsheet: you type, calculate, test scenarios and prepare a table for a meeting. Nothing beats it for one-off work and data entry.
- Power BI is a dashboard tool: it fetches data where it lives, cleans it with recorded steps, links tables together and publishes interactive pages that other people can browse and filter without touching the data.
So the real question isn't "which one is better?" It's "am I doing the same manual work over and over?"
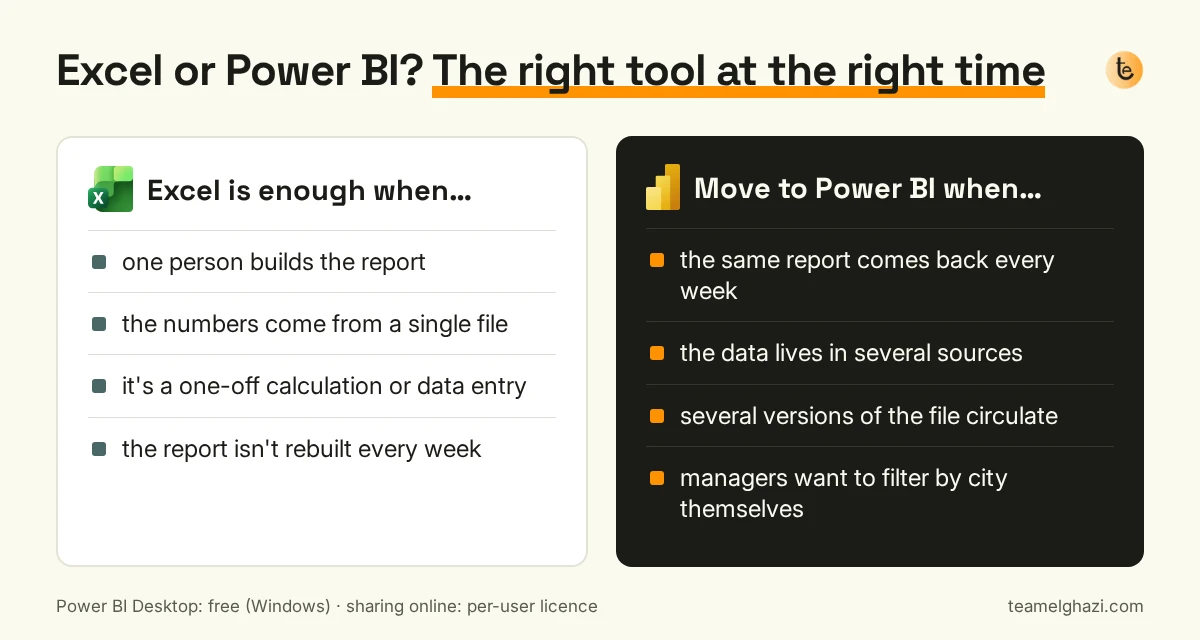
5 signs it's time to move to Power BI
1. You rebuild the same report every Monday
Export the sales, paste them into this month's tab, drag the formulas down again, redo the chart. If it's the same sequence of clicks every week, that's exactly what Power BI automates. Power Query records your cleaning steps once; after that, one click on "Refresh" does the whole job.
2. Your numbers come from several places
A shop's till, an export from your accounting or stock software, a Google Sheet the sales rep keeps, a file sent over from the Tangier depot. Excel can combine them, but by hand and with fragile VLOOKUPs. Power BI links the sources on a shared key (the same product code, the same date) and keeps that link.
3. Several versions of the file are going around
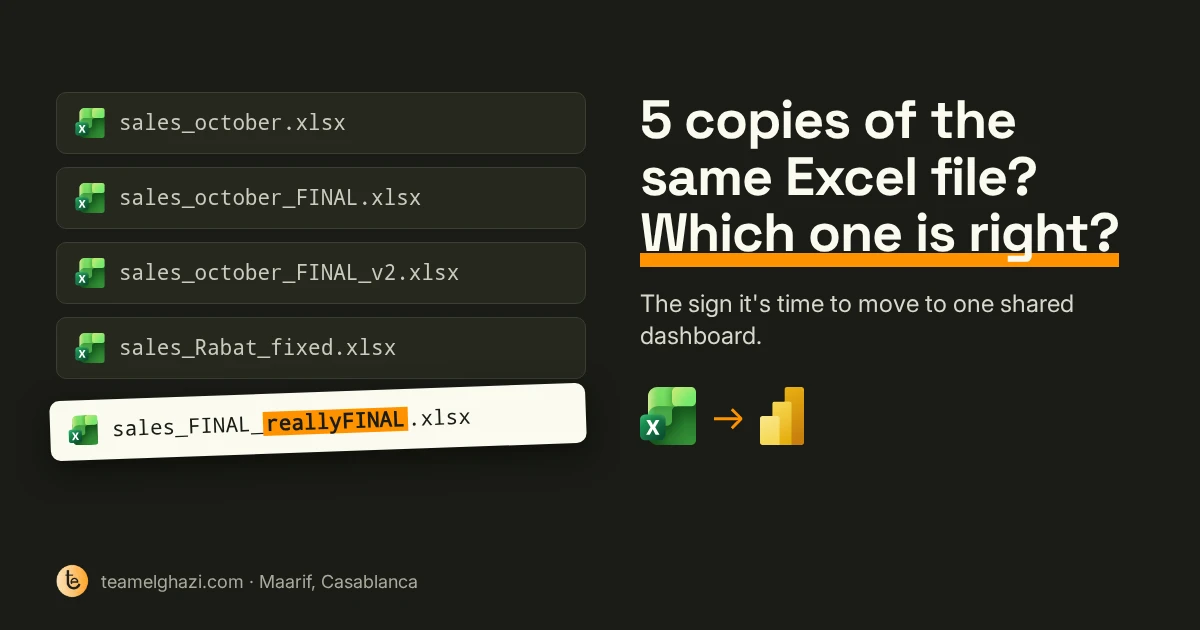
"sales_FINAL_v2", "sales_Rabat_fixed", "sales_reallyFINAL". When everyone has their own copy, nobody knows which one is right, and meetings start with an argument about the numbers instead of a decision. A published dashboard gives one version, the same for everyone.
4. Management always has the next question
"What about Marrakech?", "What if we take out returns?", "Same month last year?". In Excel, each question means a new pivot table. In Power BI, the person asking clicks the city, product or month themselves.
5. The file is getting slow or fragile
Tens of thousands of rows, tabs tied together by formulas only one person understands, a workbook that takes a minute to open. That's the moment to separate the data (stored and cleaned) from the presentation (the dashboard).
One sign on its own doesn't always justify the switch. Once you tick two or three, the time lost every week easily outweighs the time it takes to learn.
A typical case: three shops, one Monday report
Here's an example (a typical case, not a real client): a distributor with three outlets in Casablanca, Rabat and Marrakech. Every Monday an assistant collects three till exports, pastes them into one workbook, fixes product names spelled three different ways, recalculates totals per city and sends the file to the manager on WhatsApp. Two hours of work, and then the manager asks for a breakdown by category.
With Power BI, the three exports go into one folder. Power Query combines them and applies the saved fixes (product names, dates, returns). The dashboard shows revenue by city, by category and by week. On Monday you just refresh, and the manager filters it himself. The assistant's job shifts from copying to checking.
What Excel still does better
- Data entry and small lists (an inventory, a schedule).
- One-off calculations and what-if scenarios: "what if we raise the price by 5%?"
- Documents you send as they are: a quote, a statement to print.
Power BI also reads Excel files perfectly well. In most small businesses Excel stays upstream (where data gets entered) and Power BI downstream (where it gets tracked). And if your data already sits in clean tables, Power Query is built into Excel too, which makes it a good first step.
Where to start, in 4 steps
- Pick one report, the one you rebuild most often. Not the whole company at once.
- Put your data in clean tables: one row per sale, one column per field, no merged cells and no subtotals in the middle.
- Build one dashboard page with no more than 4 key figures (for example revenue, number of sales, average basket, change versus last month) and 2 or 3 filters (city, product, month).
- Decide who sees what before sharing. Sales figures are sensitive, and as soon as customer personal data is involved, Moroccan law 09-08 applies (overseen by the CNDP).
If you'd rather have us build the pipeline for you (automatic collection of exports, cleaning, a summary sent every Monday), that's an automation and automated reporting project, from 5,000 MAD with a free quote. Our guide on what a Moroccan SME should automate first helps you choose where to begin.
Learn Power BI (or Python) with TeamElGhazi
- Power BI for Beginners: 6 weeks, live online, 1,000 MAD. Power Query, essential DAX, table relationships, filters and slicers, publishing, and a decision dashboard as your final project.
- Python Fundamentals: 6 weeks online, 1,000 MAD, if you'd rather automate CSV and Excel processing with scripts. See also our Python course in Casablanca page.
- Data Science & AI: 4 months online, 3,000 MAD, to go further with Pandas analysis and your first predictive models.
For a whole team, corporate training is quoted on request. Not sure about the format? Read online or in-person training.
Frequently asked questions
Does Power BI replace Excel?
No. Excel remains the tool for data entry, one-off calculations and small lists. Power BI pulls several data sources together, cleans them once and publishes a dashboard that several people can view and filter. In most small businesses the two live side by side: Excel upstream, Power BI for tracking.
Is Power BI free?
Power BI Desktop, the app you use to build reports, is a free download for Windows. To publish a report online and share it with colleagues, Microsoft generally requires a paid per-user licence, priced on its website. To learn and build your first dashboards, the free version is enough.
Do I need to code to use Power BI?
No. You import and clean data with Power Query using clicks, then build charts by drag and drop. DAX formulas look a lot like Excel formulas, and a handful are enough to start: sums, counts and period-over-period comparisons.
How long does it take to learn Power BI?
If you already use Excel every day, a few weeks of regular practice are enough to build a useful dashboard. Our Power BI for Beginners course runs for 6 weeks, live online, for 1,000 MAD, and ends with a decision dashboard built on a real case.
All our courses are listed on the courses page; more answers are in our FAQ.
Does a report eat hours of your week? Tell us about it: the quote is free.
Request a quote